ETH Holds Above $2K But Bearish Signs Start to Appear: Ethereum Price Analysis
Technical Analysis
Ethereum’s recent market activity highlights a dominant presence of buyers, propelling the price into a robust uptrend and reaching the pivotal resistance level of $2K. However, there is a potential for a temporary consolidation phase around this crucial resistance in the coming days.
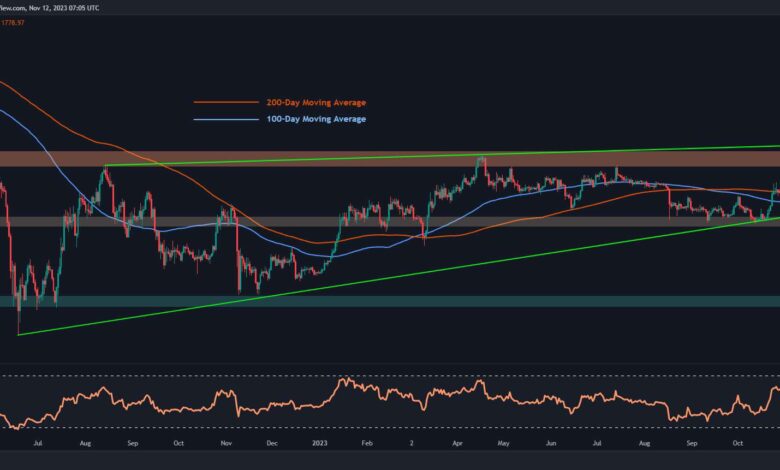
Upon analyzing the daily chart, it is evident that a successful breakout above the 100-day and 200-day moving averages at approximately $1,700 fueled significant bullish momentum, resulting in a noteworthy surge. The intensified buying pressure led to the price reaching the critical $2K resistance zone, marked by its psychological significance and prevailing supply.
Despite this upward movement, Ethereum has formed a long-term rising wedge pattern, with the price on the verge of breaking above its upper trendline.
If buyers successfully push the price above the $2K resistance as well as the upper boundary of the wedge, a mid-term uptrend could be imminent. However, considering the existing supply around this pivotal resistance, a temporary rejection followed by consolidation toward the broken moving averages appears more likely.
On the 4-hour chart, the breakout above the upper threshold of the descending wedge prompted buyers to drive the price toward the substantial $2K resistance. This uptrend was characterized by heightened bullish momentum, illustrating the buyers’ control over the market.
Nevertheless, the $2K price region poses a crucial resistance, where buyers may encounter challenges pushing the price higher. Additionally, a noticeable bearish divergence between the price and the RSI indicator suggests that the current buying pressure might not be sufficient, potentially leading to a minor rejection followed by slight corrections. Consequently, the market could witness increased volatility until bullish momentum is reinstated to reclaim this pivotal resistance.
Given the current market scenario, there’s a high probability of an extended consolidation correction phase in the short term. This implies that the market might continue its sideways movement before definitively determining its next course of action.

Ethereum has demonstrated a robust upward momentum, experiencing a significant rally in recent weeks and nearing the critical $2,000 level. To gauge the sustainability of this surge, it is crucial to examine sentiment in the futures market, providing valuable insights into market dynamics.
The chart depicts funding rates, a crucial metric that offers a glimpse into trader sentiment in the perpetual futures market, with values proportional to the number of contracts.
Recently, this metric has undergone a substantial surge in conjunction with the upward trend in Ethereum’s price, reaching its highest level since November 2021. This notable increase signifies prevailing optimism in the market, with the majority of the traders speculating on a further price increase.
However, this intensified optimism poses a potential risk. Excessively bullish sentiment, as reflected in the elevated funding rates, may lead to a contraction in price, triggering a cascade of liquidations and the potential for a long-squeeze event. Such an event could result in a sudden rejection for Ethereum, catching traders off guard as they hurriedly exit their long positions.

Binance Free $100 (Exclusive): Use this link to register and receive $100 free and 10% off fees on Binance Futures first month (terms).
Disclaimer: Information found on CryptoPotato is those of writers quoted. It does not represent the opinions of CryptoPotato on whether to buy, sell, or hold any investments. You are advised to conduct your own research before making any investment decisions. Use provided information at your own risk. See Disclaimer for more information.
Cryptocurrency charts by TradingView.